华东师范大学学报(自然科学版) ›› 2021, Vol. 2021 ›› Issue (2): 12-20.doi: 10.3969/j.issn.1000-5641.2021.02.002

• 河口海岸学 • 上一篇    下一篇

长江口余水位时空变化及其成因

杨正东1, 朱建荣2,*(), 宋云平2, 顾靖华2   

  1. 1. 上海市崇明区水文站,上海 202150
    2. 华东师范大学 河口海岸学国家重点实验室,上海 200241
  • 收稿日期:2020-05-18 出版日期:2021-03-25 发布日期:2021-04-01
  • 通讯作者: 朱建荣 E-mail:jrzhu@sklec.ecnu.edu.cn
  • 基金资助:
    国家自然科学基金(41676083)

Spatial and temporal variations in the residual water level of the Changjiang Estuary and its cause

Zhengdong YANG1, Jianrong ZHU2,*(), Yunping SONG2, Jinghua GU2   

  1. 1. Hydrologic Station of Chongming District of Shanghai, Shanghai 202150, China
    2. State Key Laboratory of Estuarine and Coastal Research, East China Normal University, Shanghai 200241, China
  • Received:2020-05-18 Online:2021-03-25 Published:2021-04-01
  • Contact: Jianrong ZHU E-mail:jrzhu@sklec.ecnu.edu.cn

摘要:

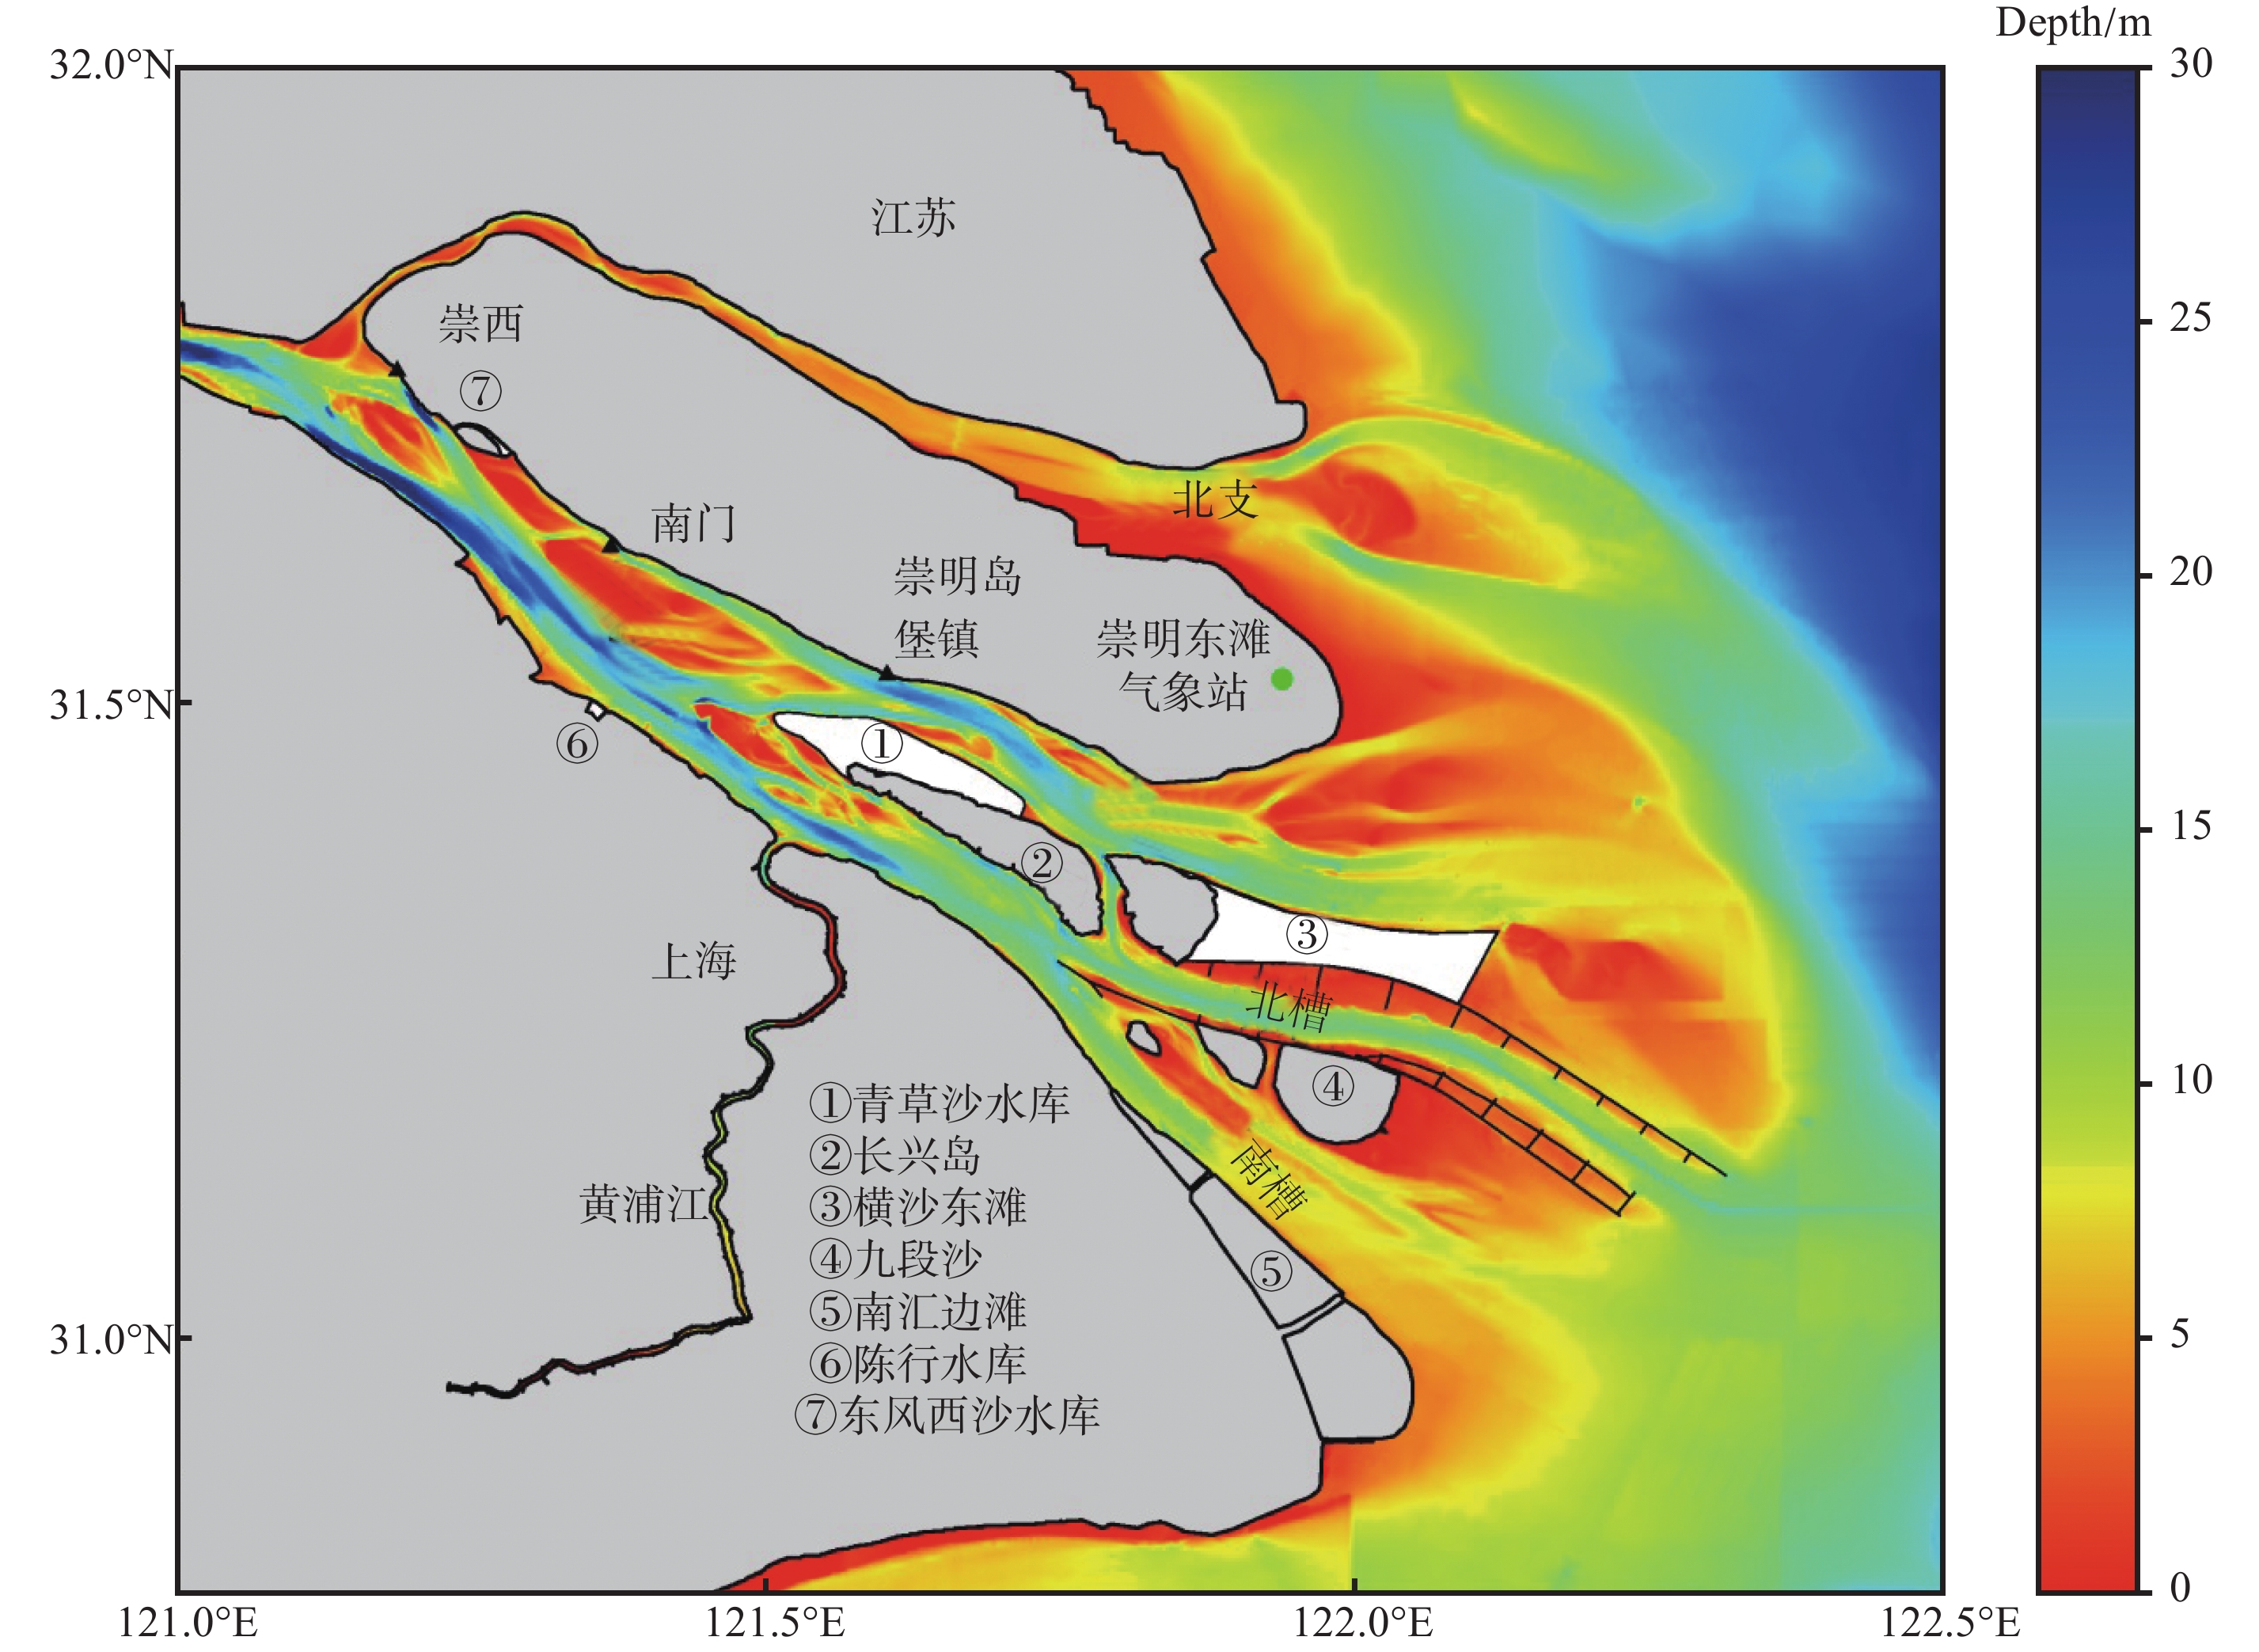
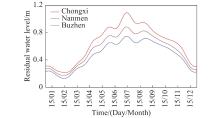
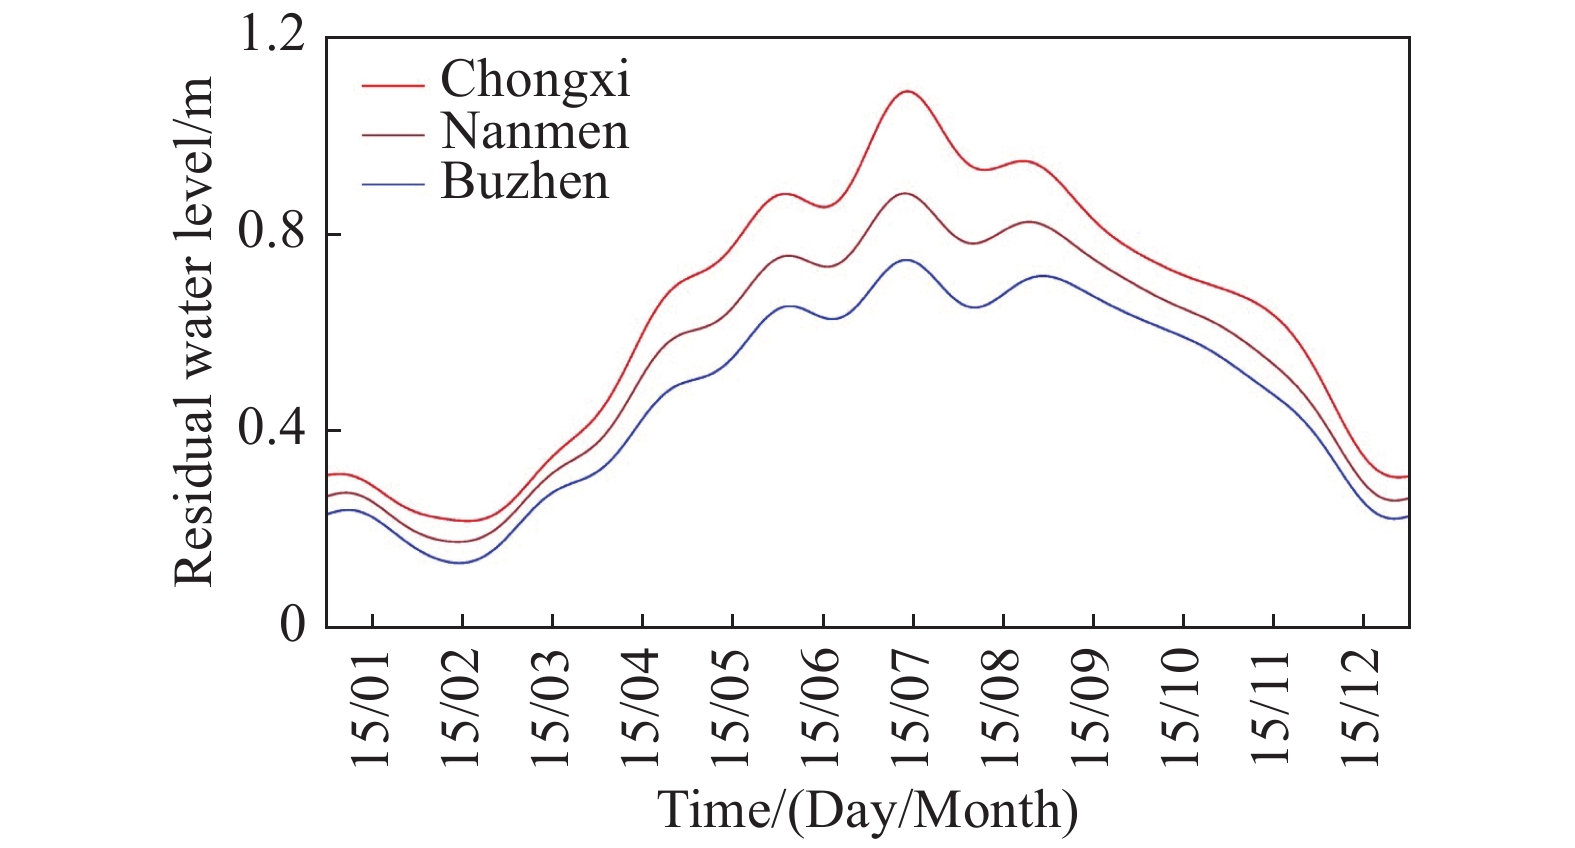
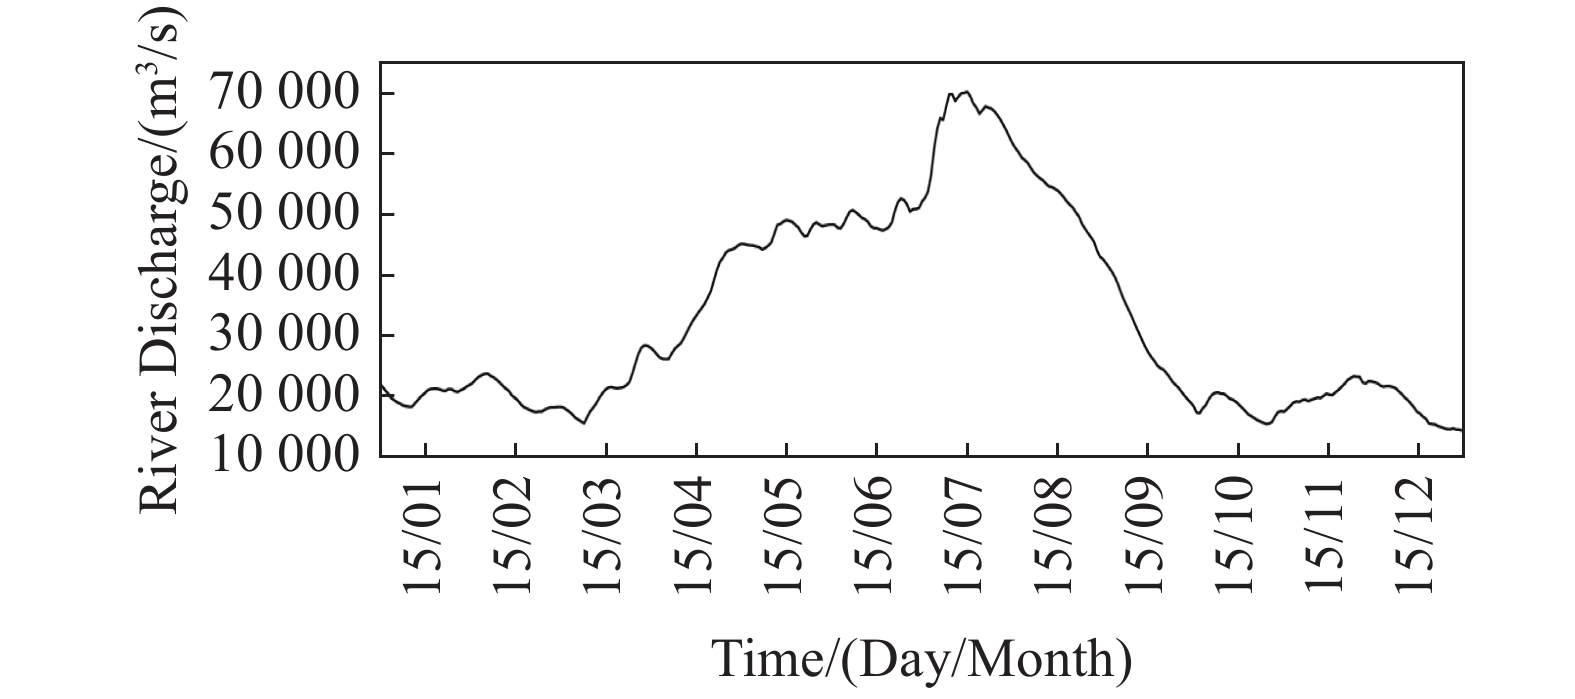
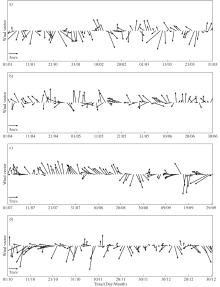
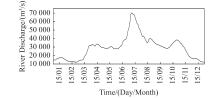
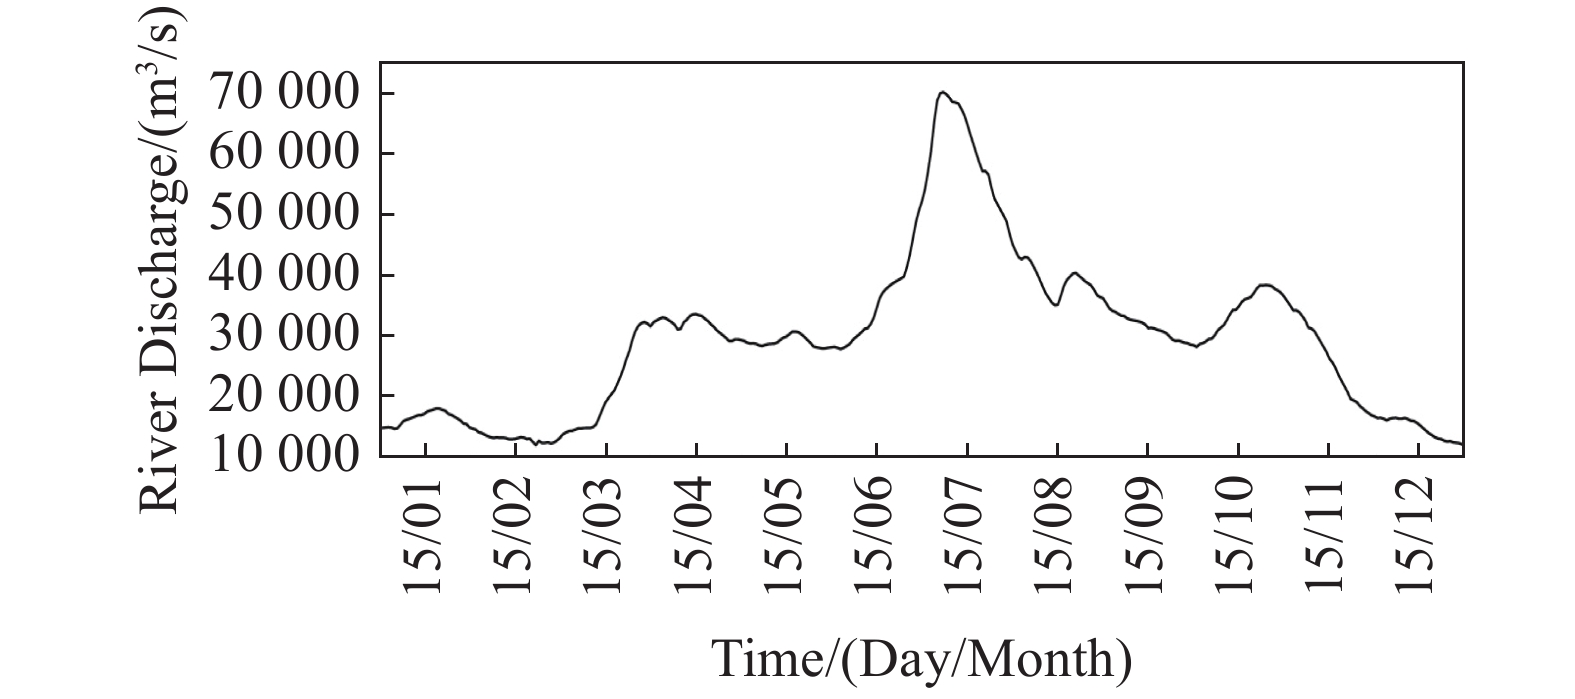
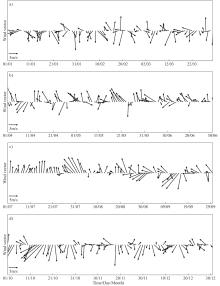
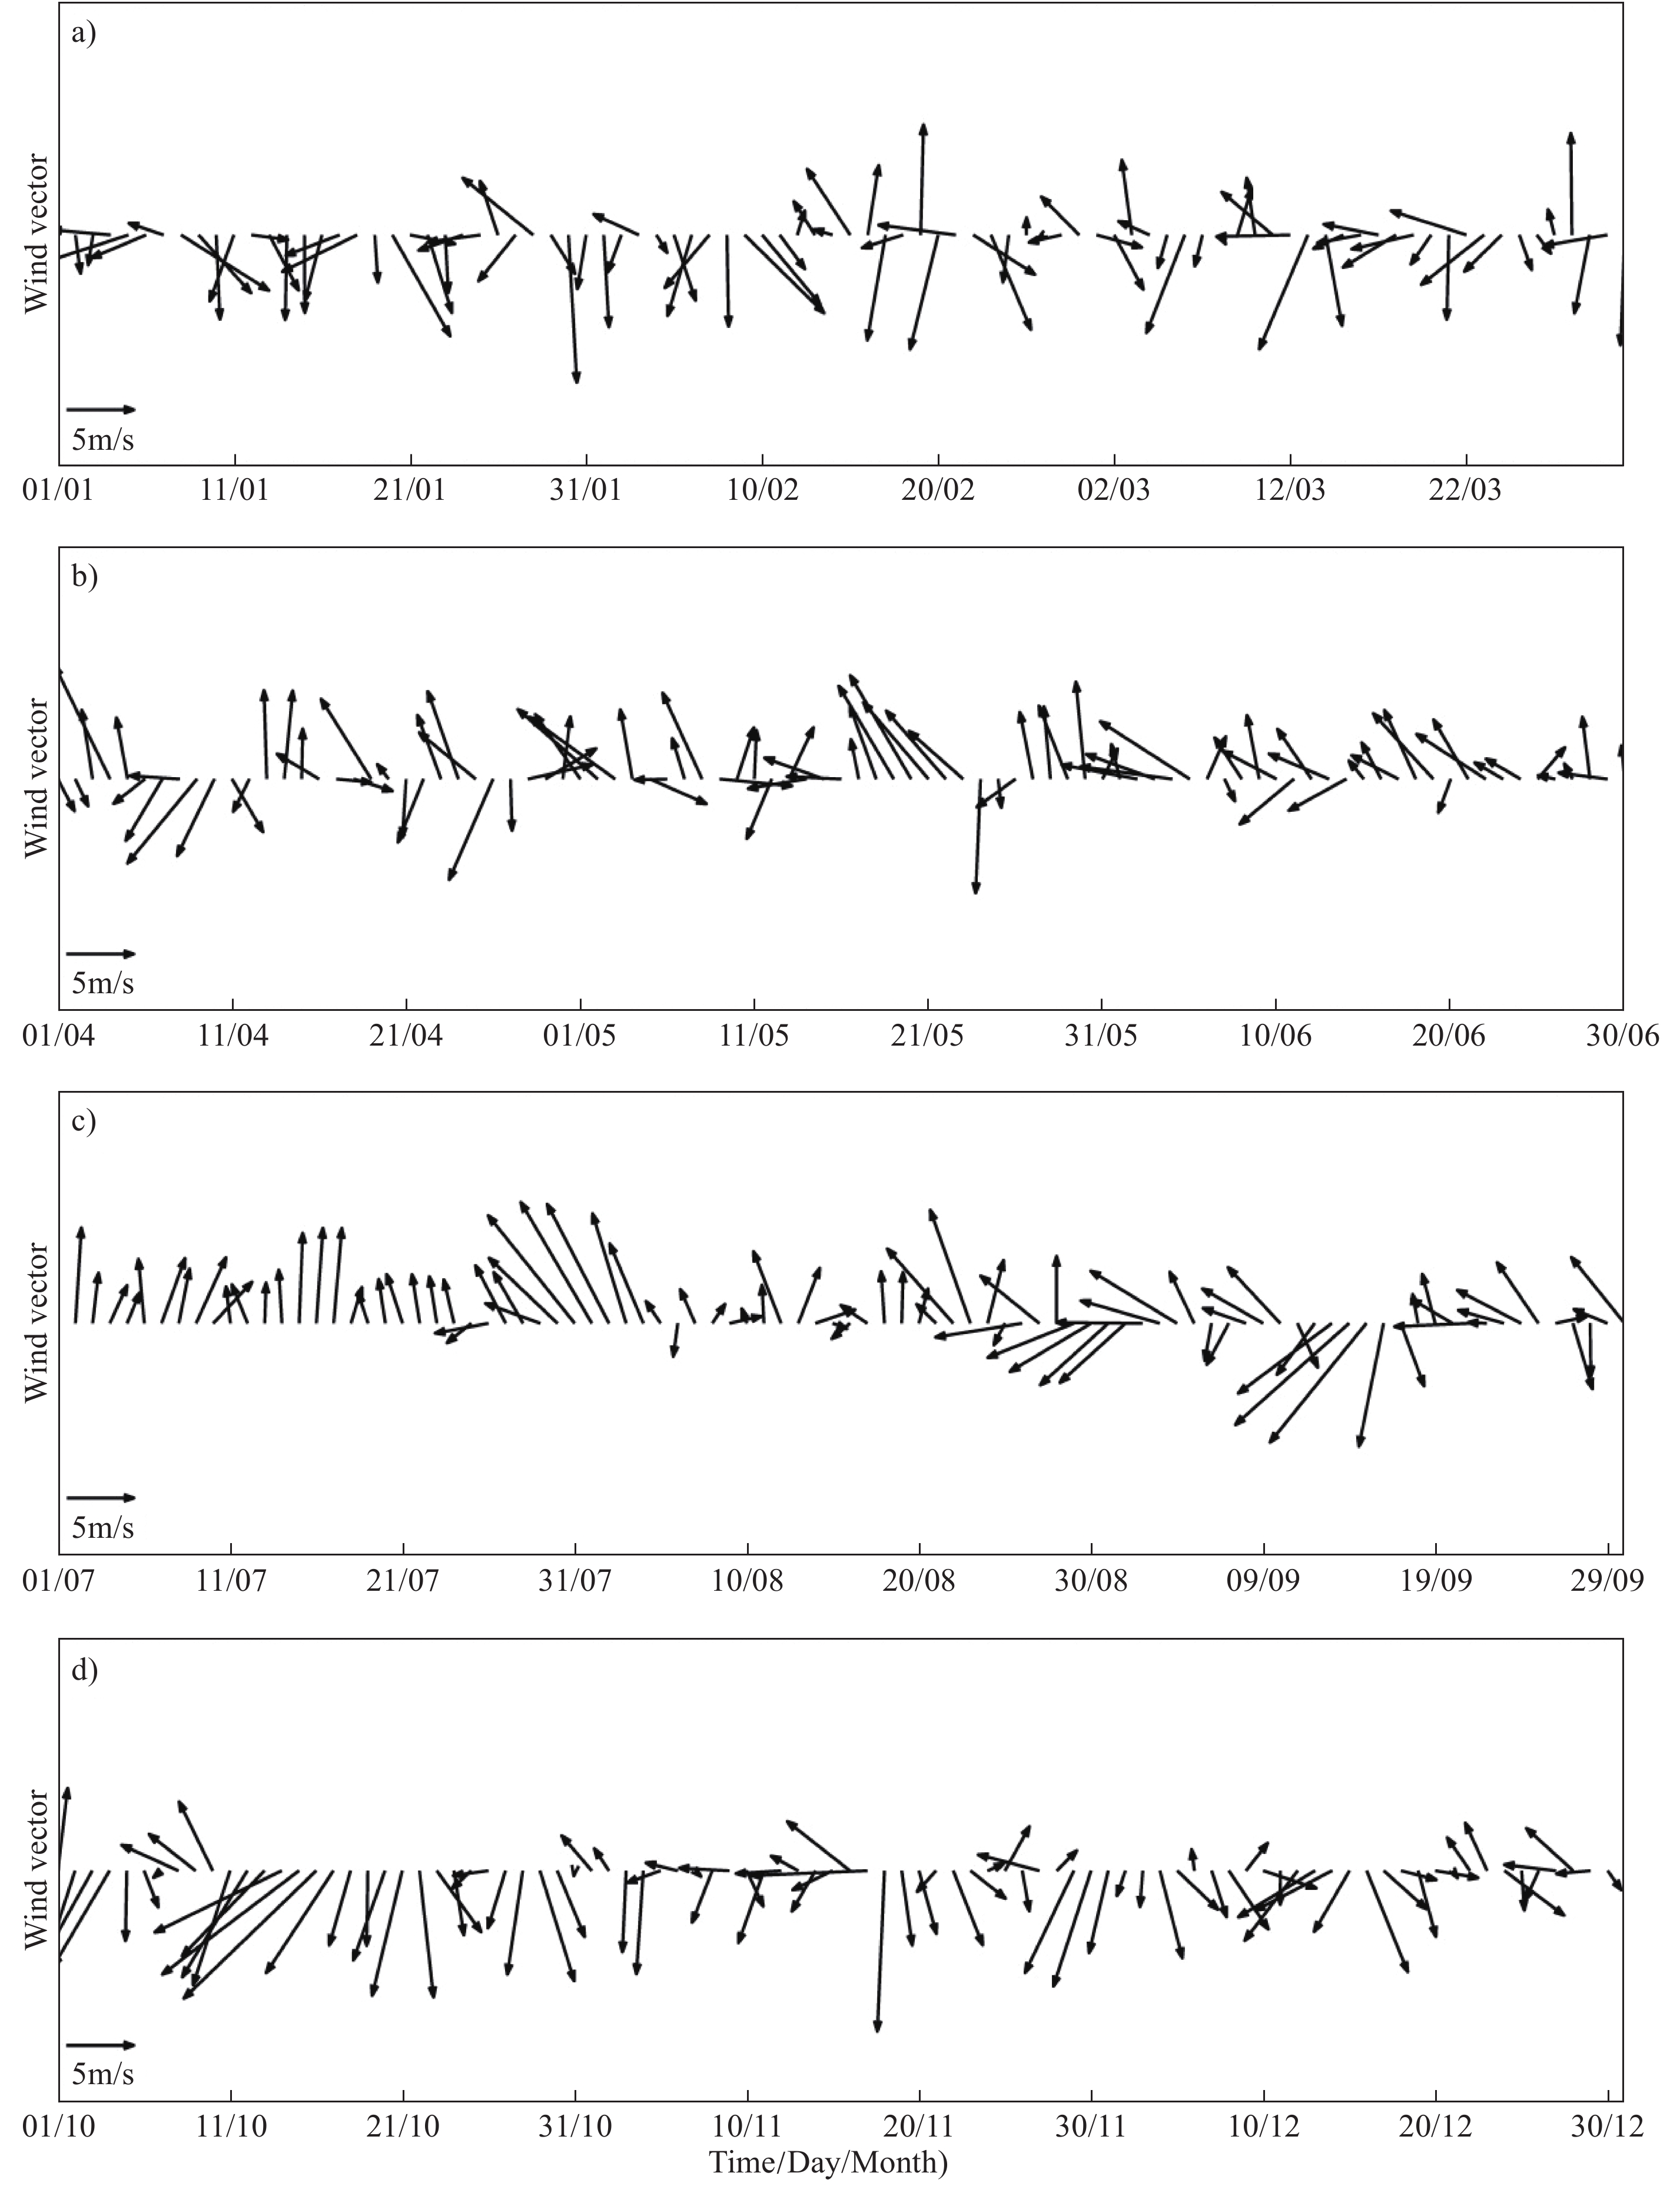
利用2016年和2017年长江口南支崇西、南门和堡镇水文站逐时水位资料, 大通水文站逐日平均径流量和崇明东滩气象站风速风向, 分析了余水位的时空变化及其成因. 结果表明, 在这3个水文站中, 各月余水位崇西水文站最高, 堡镇水文站最低; 各水文站余水位的落差在低径流量期间较小, 在高径流量期间趋大. 径流量越大, 上下游余水位落差越大. 在2016年, 崇西、南门和堡镇水文站2月余水位最低, 量值分别为2.09 m、1.96 m和1.93 m; 7月达到最大, 量值分别为2.91 m、2.62 m和2.50 m. 余水位主要是由径流量决定的, 风况也是导致余水位变化的一个重要原因. 南风导致余水位下降,北风导致余水位上升. 在2017年, 月平均余水位最小值出现在12月, 崇西、南门和堡镇水文站量值分别为2.04 m、1.91 m和1.87 m, 是由全年最低径流量导致的; 月平均余水位最大值出现在10月, 量值分别为2.79 m、2.58 m和2.49 m. 尽管10月径流量比7月低了24214 m3/s, 但余水位比7月还高, 原因是10月中下旬持续的强偏北风, 产生了强烈的向岸艾克曼水体输运, 导致水位上升. 长江口余水位时空变化显著, 在工程设计和理论研究中需要考虑.

关键词: 长江口, 余水位, 时空变化, 径流量, 风况

Abstract:

In this study, we analyzed the spatial and temporal variations in the residual water level of the Changjiang Estuary and evaluated the respective causes. To achieve this objective, we used data from the hourly water level at the Chongxi, Nanmen, and Baozhen hydrological stations in the Changjiang Estuary; daily river discharge levels at the Datong hydrological station; and wind speed and direction at the Chongming eastern shoal weather station in 2016 and 2017. The results showed that the residual water level was the highest at Chongxi station and the lowest at Baozhen station among the three hydrological stations in each month. The drops in residual water level among the hydrological stations became smaller during low river discharge and tended to become larger during high river discharge. Higher levels of river discharge were associated with a larger drop in the residual water level. In 2016, the residual water levels at the Chongxi, Nanmen, and Baozhen hydrological stations were lowest in February with values of 2.09, 1.96, and 1.93 m, respectively; similarly, the residual water levels were the highest in July with values of 2.91, 2.62, and 2.50 m, respectively. The residual water level was mainly affected by river discharge, while the wind was also an important influencing factor in the variations observed. Southerly wind made the residual water level decrease, and northerly wind made it increase. In 2017, the minimum monthly mean residual water level occurred in December with values of 2.04, 1.91, and 1.87 m at the Chongxi, Nanmen, and Baozhen hydrological stations, respectively; this coincided with the lowest annual river discharge observed during the same period. The maximum monthly mean residual water level occurred in October with values of 2.79, 2.58, and 2.49 m at the Chongxi, Nanmen, and Baozhen hydrological stations, respectively. Although the river discharge was lower in October than the one in July by 24214 m3/s, the residual water level was higher in October than that in July. The explanation for this phenomenon is the persistent strong northerly wind observed in middle to late October, which produced strong landward Ekman water transport, and resulted in the water level rise. The spatial and temporal variation in the residual water level of the Changjiang Estuary is remarkable, and should be considered in engineering design and theoretical research.

Key words: Changjiang Estuary, residual water level, spatial and temporal variation, river discharge, wind

中图分类号: